


Contents
Scroll to:
https://doi.org/10.14341/omet13088
Scroll to:
BACKGROUND. Due to its role as a risk factor for the emergence of metabolic illnesses including type 2 diabetes, cardiovascular disease, and certain cancers with pandemic evolution, obesity is a serious public health concern. Diabetes mellitus type 2 (T2DM) poses a major risk to human health. The byproducts of the breakdown of cholesterol are bile acids, which are crucial for preserving cholesterol homeostasis. Research indicates that bile acids might control insulin sensitivity, energy metabolism, and glucose tolerance. Farnesoid X receptors (FXRs) are crucial for controlling bile acid production and hepatic glucose metabolism. The ligand for FXR The semisynthetic derivative of chenodeoxycholic acid, a bile acid, is obeticholic acid (OCA). Research indicates that bile acids may be a viable therapeutic target for type 2 diabetes (T2DM) given that therapy with oleic acid (OCA) enhanced insulin sensitivity and decreased indicators of liver inflammation and fibrosis in individuals with T2DM and nonalcoholic steatohepatitis (NASH).
AIM. To assess Obeticholic acid’s effectiveness in obese individuals with prediabetes.
MATERIALS AND METHODS. Over the course of three months, we performed a randomized single blind placebo controlled trial on eighty-two overweight and obese patients with prediabetes in the outpatient clinic at Ain Shams University Hospital. Through block randomization, patients were split into two groups (Group A received daily oral tablets containing 5 mg of obeticholic acid, while Group B received non-sweet capsules as a placebo). Three follow-up visits were conducted to ensure adherence and monitor for any emergence of side effects.
RESULTS. 82 patients of matched age and sex criteria who underwent block randomization into 2 equal groups, group (A) representing cases and group (B) the placebo controlled group, with 3 months’ regular follow up showed at end of treatment statistically significant difference in weight being lower in group (A) with p-value 0.004 with decreased parameters of glycemic profile (Fasting insulin, FPG, HOMA_IR, 2h PP, HbA1c) in group (A) with p-value <0.001 except 2hpp which p-value is 0.006. Also ALT was much decreased in group (A) with p-value <0.001. Lipid profile didn’t show significant difference between 2 groups except for TGs which deceased in follow up in group (A) with p-value <0. 001. Additionally, it should be highlighted that there was no statistically significant difference between the control group’s baseline and post-treatment data.
CONCLUSION. In individuals who are overweight or obese and have insulin resistance and prediabetes, activation of FXR by OCA results in enhanced insulin sensitivity. Patients who received OCA also lost weight.
Amer H., Nesim M., Mansour H., Nasr E., Ahmed N. Obeticholic Acid and Insulin Sensitivity in Overweight Patients with Prediabetes. Obesity and metabolism. 2024;21(2):161-169. https://doi.org/10.14341/omet13088
Due to its role as a risk factor for the emergence of metabolic illnesses including type 2 diabetes, cardiovascular disease, and certain cancers with pandemic evolution, obesity is a serious public health concern [1]. In addition to the physical impairments associated with obesity and diabetes, these illnesses pose a significant threat to society’s health and quality of life. They also have significant psychological ramifications [2]. One of the main causes of morbidity and mortality is also metabolic diseases. By 2030, there will be 3.3 billion overweight individuals globally, and more than 400 million people will have diabetes [3]
A condition known as insulin resistance occurs when the biological impact of a particular insulin concentration on glucose levels is less than anticipated [4]. The homeostasis model evaluation of insulin resistance index is now the most viable noninvasive surrogate measure of insulin resistance. [ HOMA-IR = fasting plasma glucose (mmol/L) × fasting insulin (μIU/mL)/22.5]. Since HOMA-IR is inexpensive, reproducible, and simple to measure, it is a valuable tool for identifying insulin resistance. ideal insulin sensitivity in cases where HOMA-IR is smaller than 1. Significant insulin resistance is indicated by values above 2.9, whereas early insulin resistance is indicated by levels above 1.9 [5].
Individuals with a fatty liver may be even more predictive in non-obese patients. Patients at high risk of developing insulin resistance and diabetes are obese, have characteristics of the metabolic syndrome, or have a family history of type 2 diabetes [6]. Glycemic values that are above normal but below the diabetes threshold characterize prediabetes, an intermediate condition of hyperglycemia. A delayed diagnosis is inevitable when individuals who are insulin-resistant are not identified and treated in a timely manner [7].
The first medication that targets FXR, obeticholic acid (OCA), has been shown to be beneficial in treating liver fibrosis.The xenosensors Pregnane X receptor (PXR), Constitutive androstane receptor (CAR), and aryl hydrocarbon receptor (AhR) as well as a number of nuclear receptors, including peroxisome proliferator activated receptors (PPARs), liver X receptors (LXR), and farnesoid X receptor (FXR). In order to preserve the essential role of maintaining nutritional homeostasis between the fed and fasting states, these transcription factors incorporate changes in environmental or hormonal cues either directly through gene regulation or indirectly through cross-talk with other transcriptional regulators. Endocrine disturbance is well-represented by insulin resistance, which arises from the improper activation of one of the previously listed nuclear receptors [3–5].
FXRs, or farnesoid X receptors, are crucial for controlling the production of bile acid and the metabolism of glucose in the liver. The bile acid chenodeoxycholic acid is the semisynthetic derivative of the FXR ligand obeticholic acid (OCA). Research has demonstrated that in individuals with T2DM and nonalcoholic steatohepatitis (NASH), therapy with OCA enhanced insulin sensitivity and decreased indicators of liver inflammation and fibrosis [6–8].
It has been demonstrated that obeticholic acid improves blood enzymes in a number of illnesses, such as primary biliary cholangitis (PBC, also known as primary biliary cirrhosis) and nonalcoholic steatohepatitis (NASH) as shown in the mechanism of action in figure 1. In 2016, obeticholic acid received provisional approval for treatment of primary biliary cholangitis in the United States. It is now being studied for treatment of other liver disorders, such as nonalcoholic steatohepatitis (NASH) and primary sclerosing cholangitis (PSC). There are 5 and 10 mg pills of obeticholic acid available [9].
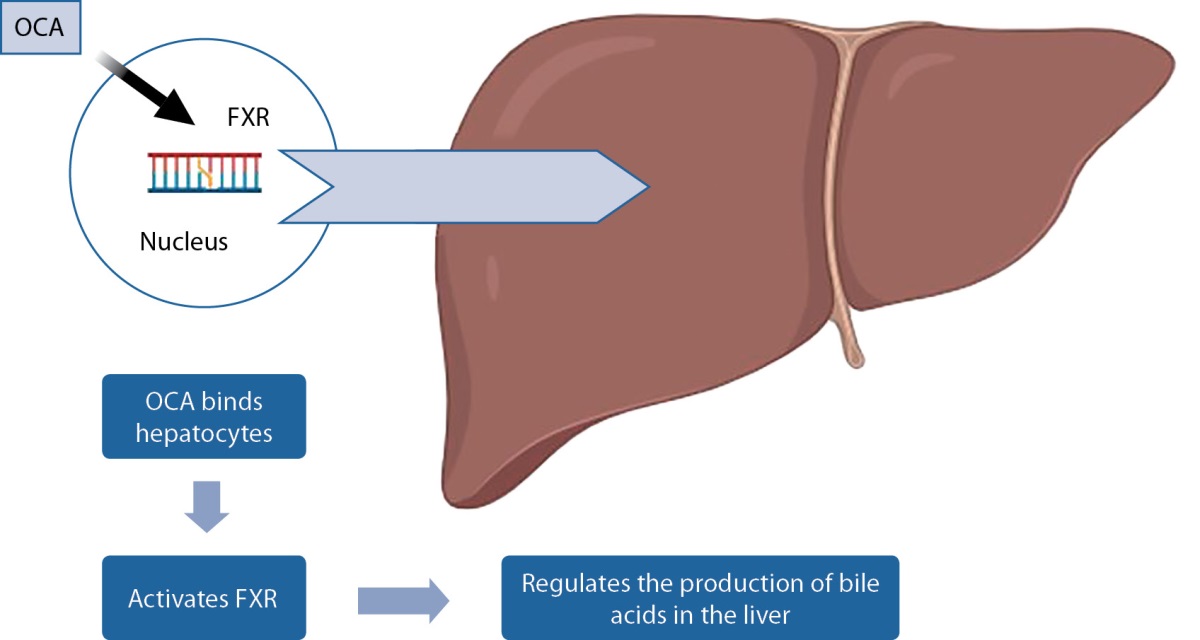
Figure 1. Mechanism of action of OCA.
This research aims to assess the effectiveness of obeticholic acid in prediabetic obese subjects.
Study site. Ain Shams University hospital.
Time of the study. From September 2021 till July 2022.
Inclusion criteria: Aged 18-65 years, overweight or obese (BMI ≥25), diagnosed with prediabetes (defined as impaired fasting glucose [IFG]: fasting plasma glucose between 100–125 mg/dl and/or impaired glucose tolerance [IGT]: a 2-hour plasma glucose between 140–199 mg/dl during an oral glucose tolerance test [OGTT] and/or HbA1c between 5.7–6.4%) using ADA 2022 for diagnosis of prediabetes, normal liver function tests, and ability to understand and give informed written.
Exclusion criteria: Obeticholic acid hypersensitivity during pregnancy or nursing, Treatment with a hypoglycemic drug, liver disease other than fatty liver, particularly viral hepatitis, or abnormal renal function (serum creatinine >2 mg/dL).
The withdrawal criteria: failure of follow up or patient desire.
This was a randomized single blinded placebo-controlled clinical trial.
Randomization was used, and all patients underwent a thorough history, clinical examination, and informed written consent after being informed about the drug Obeticholic acid 5mg and potential side effects such as itching, fatigue, abdominal pain and discomfort, rashes, mouth and throat pain, dizziness, constipation, joint pain, differences in thyroid function, and eczema. They were also advised to discontinue the medicine and alert the researcher via the contact number if any ill effects occurred. Investigations before obtaining medicine include Glycemic profile (fasting plasma glucose (mg/dl), 2 hours plasma glucose (mg/dl), fasting insulin (micro unit/ml), HbA1c), HOMA-IR = [fasting insulin (μIU/mL) × fasting glycaemia (mmol/L)]/22.5, lipid profile (total cholesterol (mg/dl), LDL (mg/dl), HDL (mg/dl), triglycerides (mg/dl), serum creatinine, and liver function tests (ALT).
At second visit (1 month after 1st visit)
Patients were examined on previously informed adverse effects and compliance.
At third visit (2 months after 2nd visit)
Patients were reviewed about any developed side effects and their compliance. They were subjected to: Anthropometric parameters and Follow up investigations after receiving medication for 3 months included Glycemic profile (fasting plasma glucose (mg/dl), 2hours plasma glucose (mg/dl), fasting insulin (micro unit/ml), HbA1c), HOMA-IR, Lipid profile (total cholesterol (mg/dl), LDL (mg/dl), HDL (mg/dl), triglycerides (mg/dl)).
Written consent was obtained after explaining the importance of the study, all procedures involved, and the 5% chance of itching, fatigue, abdominal pain and discomfort, rashes, mouth and throat pain, dizziness, constipation, joint pain, differences in thyroid function, and eczema.
Version 23 of the Statistical Package for Social Science (IBM SPSS) was used to enter, edit, and review the data. Whereas non-parametric data were shown as median with inter-quartile range (IQR), parametric data were shown as mean, standard deviations, and ranges. Quantitative variables were also shown as percentages and numbers. The following p-value was regarded as significant when P-value <0.05.
The research ethics committee of Ain Shams University’s Endocrinology Department, Faculty of Medicine, accepted the study protocol. The facts of the technique, purpose of the work, benefits, and hazards of the study disclosed to all patients. All data collected remained private and was solely used for research purposes. Protocol number MS 478/2021.
82 patients underwent block randomization into 2 equal groups, group (A) representing cases and group (B) the placebo controlled group, table 1 shows a comparison between case (group A) and control (group B) as regards demographic data (gender, age) and presence of acanthosis nigricans with no difference between the two groups.
Table 1. Comparison between case (group A) and control (group B)
as regards demographic data (gender, age) and presence of acanthosis nigricans
|
Group (A) |
Group (B) |
Test value |
P-value |
Sig. |
||
|
No. = 41 |
No. = 41 |
|||||
|
Gender |
Female |
40 (97.6%) |
41 (100.0%) |
1.012* |
0.314 |
NS |
|
Male |
1 (2.4%) |
0 (0.0%) |
||||
|
Age (years) |
Mean ± SD |
42.90±8.43 |
39.61±9.61 |
-1.649• |
0.103 |
NS |
|
Range |
26–59 |
20–54 |
||||
|
Acanthosis |
No |
17 (41.5%) |
15 (36.6%) |
0.205* |
0.651 |
NS |
|
Yes |
24 (58.5%) |
26 (63.4%) |
||||
Note. P-value >0.05: Non significant; P-value <0.05: Significant;
P-value <0.01: Highly significant. *: Chi-square test; •: Independent t-test.
Comparison between case (group A) and control (group B) as regards baseline (pre-clinical trial) data including BMI, glycemic profile (Fasting insulin, FPG, HOMA_IR, 2h PP, HbA1c), liver function test and lipid profile was presented in table 2. there was no significant difference between the two groups as regards the baseline investigations. With 3 months’ regular follow up showed at end of treatment statistically significant difference in weight being lower in group (A) with p-value 0.004 with decreased parameters of glycemic profile (Fasting insulin, FPG, HOMA_IR, 2h PP, HbA1c) in group(A) with p-value <0.001 except 2hpp which p-value is 0. 006. Also ALT was much decreased in group (A) with p-value <0.001.
Table 2. Comparison between case (group A) and control (group B)
as regards baseline (pre-clinical trial) data including BMI, glycemic profile
(Fasting insulin, FPG, HOMA_IR, 2h PP, HbA1c), liver function test and lipid profile
|
Pre |
Group (A) |
Group (B) |
Test value |
P-value |
Sig. |
|
|
No. = 41 |
No. = 41 |
|||||
|
Height (cm) |
Mean ± SD |
159.51±3.81 |
160.59±3.94 |
1.254• |
0.213 |
NS |
|
Range |
154–170 |
153–167 |
||||
|
Weight (kg) |
Mean ± SD |
100.05±20.05 |
108.22±17.93 |
1.945• |
0.055 |
NS |
|
Range |
76–160 |
85–150 |
||||
|
BMI (kg/m²) |
Mean ± SD |
39.20±7.38 |
42.26±8.18 |
1.783• |
0.078 |
NS |
|
Range |
30.4–61.7 |
32.7–61.6 |
||||
|
Fasting insulin (microU/ml) |
Median (IQR) |
14.1 (10.7–18.7) |
13 (10.8–18) |
-0.209≠ |
0.835 |
NS |
|
Range |
4.5–40.1 |
8–41.6 |
||||
|
FPG (mg/dl) |
Mean ± SD |
110.90±9.93 |
109.34±9.36 |
-0.732• |
0.466 |
NS |
|
Range |
92–129 |
99–125 |
||||
|
(mmol/l) |
(6.2±1.6) |
(6±0.5) |
||||
|
HOMA_IR |
Median (IQR) |
4.1(2.8–5.5) |
4.4 (3.2–5.6) |
-0.687≠ |
0.492 |
NS |
|
Range |
1.2–12.8 |
2.1–10.7 |
||||
|
2h PP (mg/dl) |
Mean ± SD |
144.17±9.71 |
140.61±8.30 |
-1.786• |
0.078 |
NS |
|
Range |
128–162 |
127–157 |
||||
|
(mmol/l) |
(8±0.53) |
(7.8±0.47) |
||||
|
HbA1c (%) |
Mean ± SD |
5.94±0.24 |
5.91±0.24 |
-0.412• |
0.681 |
NS |
|
Range |
5.4–6.4 |
5.7–6.4 |
||||
|
Creat (mg/dl) |
Mean ± SD |
0.62±0.13 |
0.63±0.15 |
0.604• |
0.548 |
NS |
|
Range |
0.45–0.99 |
0.42–0.99 |
||||
|
(umol/l) |
(53±11.4) |
(55.7±13.2) |
||||
|
ALT (IU/L) |
Median (IQR) |
16 (14–21) |
20 (16–24) |
-1.752≠ |
0.080 |
NS |
|
Range |
10–29 |
7–32 |
||||
|
Cholesterol (mg/dl) |
Mean ± SD |
201.32±39.88 |
190.29±23.25 |
-1.529• |
0.130 |
NS |
|
Range |
143–341 |
150–231 |
||||
|
(mmol/l) |
(5.21±1.03) |
(4.92±0.6) |
||||
|
LDL (mg/dl) |
Mean ± SD |
126.34±36.87 |
117.39±27.43 |
-1.247• |
0.216 |
NS |
|
Range |
75–246 |
63–156 |
||||
|
(mmol/l) |
(3.27±0.95) |
(3.04±0.71) |
||||
|
HDL (mg/dl) |
Mean ± SD |
48.95±12.54 |
45.90±8.41 |
-1.292• |
0.200 |
NS |
|
Range |
25–81 |
31–59 |
||||
|
(mmol/l) |
(1.27±0.32) |
(1.19±0.22) |
||||
|
TGs (mg/dl) |
Mean ± SD |
144.34±59.51 |
168.15±53.67 |
1.902• |
0.061 |
NS |
|
Range |
57–283 |
85–286 |
||||
|
(mmol/l) |
(1.63±0.67) |
(1.9±0.61) |
||||
Note. P-value >0.05: Non significant; P-value <0.05: Significant;
P-value <0.01: Highly significant. •: Independent t-test; ≠: Mann-Whitney test.
Lipid profile didn’t show significant difference between 2 groups except for TGs which deceased in follow up in group (A) with p-value <0.001 (table 3).
Table 3. Comparison between case (group A) and control (group B)
after end of treatment (post clinical trial) as regards BMI, glycemic profile
(Fasting insulin, FPG, HOMA_IR, 2h PP, HbA1c), liver function test and lipid profile
|
After end of treatment |
Group(A) |
Group(B) |
Test value |
P-value |
Sig. |
|
|
No. = 41 |
No. = 41 |
|||||
|
Weight (kg) |
Mean ± SD |
96.02–20.11 |
108.32±17.72 |
2.937• |
0.004 |
HS |
|
Range |
70–158 |
85–151 |
||||
|
Fasting insulin (microU/ml) |
Median (IQR) |
8 (5.9–10) |
15 (12–17) |
-6.285≠ |
<0.001 |
HS |
|
Range |
3.3–15 |
9–21 |
||||
|
FPG (mg/dl) |
Mean ± SD |
98.51±7.06 |
108.29±8.60 |
5.626• |
<0.001 |
HS |
|
Range |
84–114 |
99–125 |
||||
|
(mmol/l) |
(5.5±0.39) |
(10±0.47) |
||||
|
HOMA_IR |
Median (IQR) |
1.9 (1.5–2.6) |
3.8 (3–5.2) |
-6.452≠ |
<0.001 |
HS |
|
Range |
0.9–3.7 |
2.2–6.4 |
||||
|
2h PP (mg/dl) |
Mean ± SD |
134.22±7.63 |
139.17±8.29 |
2.815• |
0.006 |
HS |
|
Range |
119–149 |
126–158 |
||||
|
(mmol/l) |
(7.45±0.42) |
(7.7±0.46) |
||||
|
HbA1c (%) |
Mean ± SD |
5.78±0.22 |
5.90±0.25 |
2.398• |
0.019 |
S |
|
Range |
5.4–6.4 |
5.6–6.4 |
||||
|
ALT (IU/L) |
Median (IQR) |
15 (14–19) |
22 (16–25) |
-3.330≠ |
0.001 |
HS |
|
Range |
9–24 |
7–30 |
||||
|
Cholesterol (mg/dl) |
Mean ± SD |
199.66±32.93 |
187.59±21.18 |
-1.974• |
0.052 |
NS |
|
Range |
131–319 |
152–232 |
||||
|
(mmol/l) |
(5.16±0.85) |
(4.85±0.61) |
||||
|
LDL (mg/dl) |
Mean ± SD |
125.51±28.94 |
117.95±27.06 |
-1.222• |
0.225 |
NS |
|
Range |
78–218 |
69–157 |
||||
|
(mmol/l) |
(3.25±0.75) |
(3.05±0.7) |
||||
|
HDL (mg/dl) |
Mean ± SD |
48.32±11.03 |
46.34±8.14 |
-0.923• |
0.359 |
NS |
|
Range |
28–73 |
29–58 |
||||
|
(mmol/l) |
(1.25±0.29) |
(1.2±0.21) |
||||
|
TGS (mg/dl) |
Mean ± SD |
116.46±39.06 |
169.39±51.93 |
5.216• |
<0.001 |
HS |
|
Range |
60–211 |
85–268 |
||||
|
(mmol/l) |
(3.01±1.01) |
(4.38±0.59) |
||||
Note. P-value >0.05: Non-significant; P-value <0.05: Significant;
P-value <0.01: Highly significant. •: Independent t-test; ≠: Mann-Whitney test
Additionally, it should be highlighted that there was no statistically significant difference between the control group’s baseline and post-treatment data (table 4).
Table 4. Comparison among control group (group B)
between baseline (pre-clinical trial) and after end of treatment (post clinical trial) data
as regards BMI, glycemic profile (Fasting insulin, FPG, HOMA_IR, 2h PP, HbA1c),
liver function test and lipid profile
|
Control group (Group B) |
Test value |
P-value |
Sig. |
|||
|
Pre |
Post |
|||||
|
Weight (kg) |
Mean ± SD |
108.22±17.93 |
108.32–17.72 |
-0.443• |
0.660 |
NS |
|
Range |
85–150 |
85–151 |
||||
|
Fasting insulin (microU/ml) |
Median (IQR) |
13 (10.8–18) |
15 (12–17) |
-1.678≠ |
0.093 |
NS |
|
Range |
8–41.6 |
9–21 |
||||
|
FPG (mg/dl) |
Mean ± SD |
109.34±9.36 |
108.29±8.60 |
1.160• |
0.253 |
NS |
|
Range |
99–125 |
99–125 |
||||
|
(mmol/l) |
(6.07±0.52) |
(6.01±0.47) |
||||
|
HOMA_IR |
Median (IQR) |
4.4 (3.2–5.6) |
3.8 (3–5.2) |
-1.723≠ |
0.085 |
NS |
|
Range |
2.1–10.7 |
2.2–6.4 |
||||
|
2h PP (mg/dl) |
Mean ± SD |
140.61±8.30 |
139.17±8.29 |
1.635• |
0.110 |
NS |
|
Range |
127–157 |
126–158 |
||||
|
(mmol/l) |
(7.81±0.46) |
(7.73±0.46) |
||||
|
HbA1c (%) |
Mean ± SD |
5.91±0.24 |
5.90±0.25 |
0.628• |
0.534 |
NS |
|
Range |
5.7–6.4 |
5.6–6.4 |
||||
|
ALT (IU/L) |
Median (IQR) |
20 (16–24) |
22 (16–25) |
-1.866≠ |
0.062 |
NS |
|
Range |
7–32 |
7–30 |
||||
|
Cholesterol (mg/dl) |
Mean ± SD |
190.29±23.25 |
187.59±21.18 |
2.002• |
0.052 |
NS |
|
Range |
150–231 |
152–232 |
||||
|
(mmol/l) |
(4.92±0.6) |
(4.85±0.55) |
||||
|
LDL (mg/dl) |
Mean ± SD |
117.39±27.43 |
117.95±27.06 |
-1.024• |
0.312 |
NS |
|
Range |
63–156 |
69–157 |
||||
|
(mmol/l) |
(3.04±0.71) |
(3.05±0.7) |
||||
|
HDL (mg/dl) |
Mean ± SD |
45.90±8.41 |
46.34±8.14 |
-1.204• |
0.236 |
NS |
|
Range |
31–59 |
29–58 |
||||
|
(mmol/l) |
(1.19±0.22) |
(1.2±0.21) |
||||
|
TGs (mg/dl) |
Mean ± SD |
168.15±53.67 |
169.39±51.93 |
-0.974• |
0.336 |
NS |
|
Range |
85–286 |
85–268 |
||||
|
(mmol/l) |
(1.9±0.61) |
(1.91±0.59) |
||||
Note. P-value >0.05: Non significant; P-value <0.05: Significant;
P-value <0.01: Highly significant. •: Paired t-test; ≠: Wilcoxon Signed Ranks test
But it should be noted that there was a statistically significant difference between the case group’s baseline and post-treatment data as shown in table 5.
There was no any adverse events that occur during the study.
Table 5. Comparison among case group (Group A)
between baseline (pre-clinical trial) and after end of treatment (post clinical trial) data
as regards BMI, glycemic profile, liver function test and lipid profile
|
Case group (Group A) |
Test value |
P-value |
Sig. |
|||
|
Pre |
Post |
|||||
|
Weight (kg) |
Mean ± SD |
100.05±20.05 |
96.02±20.11 |
8.462• |
<0.001 |
HS |
|
Range |
76–160 |
70–158 |
||||
|
Fasting insulin (microU/ml) |
Median (IQR) |
14.1 (10.7–18.7) |
8 (5.9–10) |
-5.217≠ |
<0.001 |
HS |
|
Range |
4.5–40.1 |
3.3–15 |
||||
|
FPG (mg/dl) |
Mean ± SD |
110.90± .93 |
98.51±7.06 |
10.961• |
<0.001 |
HS |
|
Range |
92–129 |
84–114 |
||||
|
(mmol/l) |
(12.2±0.55) |
(5.4±0.39) |
||||
|
HOMA_IR |
Median (IQR) |
4.1 (2.8–5.5) |
1.9 (1.5–2.6) |
-5.427≠ |
<0.001 |
HS |
|
Range |
1.2–12.8 |
0.9–3.7 |
||||
|
2h PP (mg/dl) |
Mean ± SD |
145.39±9.94 |
134.22±7.63 |
7.076• |
<0.001 |
HS |
|
Range |
128–162 |
119–149 |
||||
|
(mmol/l) |
(8.07±0.52) |
(7.46±0.42) |
||||
|
HbA1c (%) |
Mean ± SD |
5.94±0.24 |
5.78±0.22 |
5.466• |
<0.001 |
HS |
|
Range |
5.4–6.4 |
5.4–6.4 |
||||
|
ALT (IU/L) |
Median (IQR) |
16 (14–21) |
15 (14–19) |
-2.351≠ |
0.019 |
S |
|
Range |
10–29 |
9–24 |
||||
|
Cholesterol (mg/dl) |
Mean ± SD |
201.32±39.88 |
199.66±32.93 |
0.667• |
0.509 |
NS |
|
Range |
143–341 |
131–319 |
||||
|
(mmon/l) |
(5.21±1.03) |
(5.61±0.85) |
||||
|
LDL (mg/dl) |
Mean ± SD |
126.34±36.87 |
125.51±28.94 |
0.378• |
0.707 |
NS |
|
Range |
75–246 |
78–218 |
||||
|
(mmol/l) |
(3.27±0.95) |
(3.25±0.75) |
||||
|
HDL (mg/dl) |
Mean ± SD |
48.95±12.54 |
48.32±11.03 |
0.897• |
0.375 |
NS |
|
Range |
25–81 |
28–73 |
||||
|
(mmol/l) |
(1.27±0.32) |
(1.25±0.29) |
||||
|
TGs (mg/dl) |
Mean ± SD |
144.34 ± 59.51 |
116.46±39.06 |
5.163• |
<0.001 |
HS |
|
Range |
57–283 |
60–211 |
||||
|
(mmol/l) |
(1.63±0.67) |
(1.32±0.44) |
||||
Note. P-value >0.05: Non significant; P-value <0.05: Significant;
P-value <0.01: Highly significant. •: Paired t-test; ≠: Wilcoxon Signed Ranks test
A diverse range of metabolic diseases collectively known as diabetes mellitus are typified by hyperglycemia, which can be brought on by either insulin resistance, inadequate insulin production, or both. Along with the other three main non-communicable illnesses (cancer, respiratory disorders, and cardiovascular disease), diabetes mellitus ranks among the top 10 causes of mortality worldwide and accounts for approximately 80% of all premature fatalities [9]. Egypt is among the top nations in the world for the number of persons with diabetes mellitus, with 8.2 million cases in 2017 and an estimated 16.7 million cases in 2045 [10]. Diabetes mellitus requires increased attention in terms of prevention and consequences because of its numerous problems and high cost. Cardiovascular diseases (CVD), including both microvascular and macrovascular disorders, are the main side effects of diabetes. Pre-diabetes, with an annual conversion rate of 5–10%, is the primary risk factor for type 2 diabetes mellitus; as such, prediabetes cannot be seen as wholly innocuous [11].
Glycemic values that are above normal but below the diabetes threshold characterize prediabetes, an intermediate condition of hyperglycemia. Prediabetes is defined by the American Diabetes Association as either impaired glucose tolerance [IGT] — a 2-hour plasma glucose between 140-199 (mg/dl) during an oral glucose tolerance test [OGTT] — or impaired fasting glucose [IFG] — a plasma glucose between 100–125 mg/dl and/or HbA1c between 5.7% and 6.4% [7].
Insulin resistance occurs when a particular insulin concentration has a less biological effect on glucose levels than predicted. To maintain normal glucose tolerance, pancreatic β cells secrete more insulin. Insulin resistance is the first identifiable aberration in the natural history of type 2 diabetes mellitus, which evolves thro7gh abnormalities in both insulin action and production (β cell dysfunction). Specifically, multiple investigations have firmly proven that hyperinsulinemia, which develops in response to insulin resistance, frequently predates the development of type 2 diabetes mellitus by several years [12].
Obesity, metabolic syndrome symptoms, or a family history of Type 2 diabetes mellitus are associated with increased risk of insulin resistance and diabetes while fatty liver may be even more predictive in non-obese people [13].
The most frequent cause of insulin resistance, obesity, is linked to both a reduction in receptor count and a failure of the post-receptor to activate tyrosine kinase. Furthermore, inflammation in obesity occurs in a number of tissues, including adipose tissue, skeletal muscle, liver, gut, pancreatic islet, and brain. This inflammation, along with increased immune cell polarization and accumulation, may be linked to metabolic dysfunctions in obesity that result in insulin resistance and type 2 diabetes mellitus [14].
In cases when patients have established vascular problems and overt diabetes mellitus, a delayed diagnosis is inevitable due to inadequate surveillance and care of insulin-resistant individuals. Therefore, early screening for insulin resistance should be recommended, at the very least, in high-risk individuals, such as those with abdominal obesity, and in relatives of diabetes, in order to effectively offset the harmful consequences of chronic hyperinsulinemia. Currently available treatment methods mostly entail lifestyle adjustments once insulin resistance has been identified. However, to successfully address insulin resistance over the long term, pharmaceutical therapy is frequently required due to poor adherence to weight-loss programs and decreased physical activity [15].
After being primarily linked for many years to the intestinal lumen’s lipid digestion and the bile’s solubilization of cholesterol, bile acids (BA) now seem to have a wide range of metabolic actions as actual hormones that greatly influence energy homeostasis [16]. On the one hand, bile acids not only improve lipid transport and intestinal absorption, but are also inflammatory agents and signaling molecules that efficiently activate cell signaling pathways that regulate glucose, lipids, and energy metabolism [17]. Conversely, an increasing body of research indicates that bile acids may activate certain receptors that enhance glucose tolerance, insulin sensitivity, and energy metabolism, such as the farnesoid X receptor (FXR) and the transmembrane G protein-coupled receptor 5 (TGR5) (Bouscarel, 2008) [18]. The activities of these receptors imply that bile acids might be a possible therapeutic target for treating Type 2 diabetes mellitus [19].
We have conducted a randomized single blinded placebo controlled study on 82 overweight and obese patients with prediabetes at deleted by editor University hospital outpatient clinic throughout 3 months. Patients with matched age and sex criteria were randomized into two groups (41 per each group), Group (A) who received Obeticholic acid 5 mg oral tablets daily and Group (B) who received placebo in form of non-sweet capsules for 3 months to evaluate efficacy of Obeticholic acid in obese patients with prediabetes.
In our study, use of Obeticholic acid daily for 3 months was found to reduce insulin resistance (P<0.001) with improved glycemic parameters (fasting plasma glucose, HOMA-IR, 2h pp and HbA1c).
In a 2014, Daniele et al. discovered that FXR, as a critical regulatory element of free fatty acid metabolism, had a beneficial therapeutic impact on insulin resistance and type 2 diabetes [20]. Elevated plasma-free fatty acids contribute to insulin resistance and type 2 diabetes mellitus. Reducing plasma-free fatty acids was linked to improved insulin sensitivity in type 2 diabetes mellitus patients (P<0.001).
Shihabudeen et al. (2015) found that FXR activation increased the release of anti-inflammatory cytokines and insulin-sensitive adipokines (adiponectin and leptin), and subsequently reversed insulin resistance. Insulin resistance is linked to increased pro-inflammatory cytokines and decreased anti-inflammatory cytokines released by adipose tissue [21].
Type 2 diabetes mellitus and insulin resistance are significantly regulated by FXR. To validate the treatment efficacy and mechanism of FXR agonists on type 2 diabetes mellitus, further research is still required.
At the conclusion of our investigation, patients who took obeeticholic acid had a highly significant effect on weight reduction (P<0.001), and this effect was significantly connected with insulin sensitivity.
In a 72-week, randomized controlled trial of Obeticholic acid (OCA) in non-alcoholic steatohepatitis (NASH) in 2018, Hameed et al. discovered that OCA causes weight loss in up to 44% of NASH patients, and that OCA therapy and weight loss have additive benefits on serum aminotransferases and histology. These findings emphasize the need of evaluating the concurrent metabolic consequences of novel NASH treatments [22].
In 2019, Nyangasa et al. conducted another study to evaluate the connection of body mass index (BMI) and body fat percentage with cardio metabolic risk factors and discovered that a high BMI was strongly associated with hypertension. As a result, effective awareness-raising activities, as well as primary prevention public health policies, are required to avoid cardiometabolic illnesses associated by obesity [23]. The FXR is a key regulator that promotes lipid metabolism and organismal energy metabolism while also lowering inflammation. Based on these findings, targeting FXR may be a useful way to treating obesity-related cardiometabolic disorders.
Despite recent gains in our understanding of the link between FXRs and obesity, further research is needed to determine the particular mechanism by which FXR control obesity.
Our study found a substantial decrease in triglycerides after 3 months of using Obeticholic acid (P<0.001), but no significant difference in other lipid profile indicators.
In accordance with our findings, Lambert et al. 2003 concluded that FXR deficiency increased hepatic cholesterol, triglycerides, and high-density lipoprotein cholesterol, as well as a proatherogenic serum lipoprotein profile. FXR activation can boost lipid metabolism [24].
In 2006, Bilz et al. carried out a clinical study and discovered that chenodeoxycholic acid significantly lowers triglycerides (which is consistent with our findings). On the other hand, it decreases very low-density cholesterol; the fact that this change in LDL wasn’t statistically significant in our study may be because of its brief duration [25].
Crucially, no adverse events were found throughout the course of the trial. All participants were closely monitored for the possibility of any side effects developing, and they were advised to cease taking the medication if any did. Fortunately, this was not necessary.
Similar results were found in other clinical trials. Trauner et al. used 3-year interim data from the 5-year open-label extension of the pivotal phase 3 POISE trial for patients with primary biliary cholangitis to assess the long-term safety and efficacy of obeticholic acid and ensured drug safety [26].
It would be better if double blinded on larger scale with longer periods of follow up.
Studies comparing efficacy of OCA on insulin sensitivity in prediabetics with other conventional therapies
In addition to involving obesity, diabetes, and cardiovascular disease, metabolic diseases also have complex pathogenic mechanisms that include abnormal glucose metabolism, oxidative stress, insulin resistance, disorders of lipid metabolism, and inflammatory responses. FXR is essential for maintaining cholesterol homeostasis and the metabolism of bile acids. It may be possible to control lipid metabolism, preserve cardiovascular health, lessen insulin resistance, and improve glucose tolerance by turning on FXR. As a result, the possible function of FXR as a regulatory factor in improving insulin sensitivity, lowering indicators of liver inflammation, and mending damaged vessels has received increased attention.
Funding. No funding
Conflict of interest. The authors declare no obvious and potential conflicts of interest related to the content of this article.
Contribution of authors. There were equal contributions of all authors regarding the conception or design of the work; or the acquisition, analysis, or interpretation of data for the work; Drafting the work or revising it critically for important intellectual content. All authors read and approved the final version of the manuscript before publication, agreed to be responsible for all aspects of the work, implying proper examination and resolution of issues relating to the accuracy or integrity of any part of the work.
Acknowledgments. Selected artwork shown in the figure 1 were used from or adapted from pictures provided by Servier Medical Art (Servier; https://smart.servier.com/), licensed under a Creative Commons Attribution 4.0 Unported License.
1. REFERENCES
2. Echouffo-Tcheugui JB, Selvin E. Prediabetes and What It Means: The Epidemiological Evidence. In: Annual Review of Public Health. 2021;42(1): 59-77. doi: https://doi.org/10.1146/annurev-publhealth-090419-102644
3. Schwabe RF, Tabas I, Pajvani UB. Mechanisms of Fibrosis Development in Nonalcoholic Steatohepatitis. Gastroenterology. 2020;158(7):1913-1928. doi: https://doi.org/10.1053/j.gastro.2019.11.311
4. Magueresse-Battistoni B Le, Labaronne E, Vidal H, Naville D. Endocrine disrupting chemicals in mixture and obesity, diabetes and related metabolic disorders. World J Biol Chem. 2017;8(2):108. doi: https://doi.org/10.4331/wjbc.v8.i2.108
5. Zhou J, Huang N, Guo Y, et al. Combined obeticholic acid and apoptosis inhibitor treatment alleviates liver fibrosis. Acta Pharm Sin B. 2019;9(3):526-536. doi: https://doi.org/10.1016/j.apsb.2018.11.004
6. Matuszkiewicz-Rowińska J. Homeostatic model assessment indices in evaluation of insulin resistance and secretion in hemodialysis patients. Med Sci Monit. 2013;19:592-598. doi: https://doi.org/10.12659/MSM.883978
7. Portillo P, Yavuz S, Bril F, Cusi K. Role of Insulin Resistance and Diabetes in the Pathogenesis and Treatment of Nonalcoholic Fatty Liver Disease. Curr Hepatol Reports. 2014;13(2):159-170. doi: https://doi.org/10.1007/s11901-014-0229-3
8. American Diabetes Association; 2. Classification and Diagnosis of Diabetes: Standards of Medical Care in Diabetes—2021. Diabetes Care. 2021;44(Supplement_1):S15-S33. doi: https://doi.org/10.2337/dc21-S002
9. Rhee E-J. Nonalcoholic Fatty Liver Disease and Diabetes: An Epidemiological Perspective. Endocrinol Metab. 2019;34(3):226. doi: https://doi.org/10.3803/EnM.2019.34.3.226
10. Cho NH, Shaw JE, Karuranga S, et al. IDF Diabetes Atlas: Global estimates of diabetes prevalence for 2017 and projections for 2045. Diabetes Res Clin Pract. 2018;138:271-281. doi: https://doi.org/10.1016/j.diabres.2018.02.023
11. Ray K. Obeticholic acid for the treatment of fatty liver disease—NASH no more? Nat Rev Gastroenterol Hepatol. 2015;12(1):1-1. doi: https://doi.org/10.1038/nrgastro.2014.203
12. Bansal N. Prediabetes diagnosis and treatment: A review. World J Diabetes. 2015;6(2):296. doi: https://doi.org/10.4239/wjd.v6.i2.296
13. Singh B. Surrogate markers of insulin resistance: A review. World J Diabetes. 2010;1(2):36. doi: https://doi.org/10.4239/wjd.v1.i2.36
14. Fujii H, Kawada N. The Role of Insulin Resistance and Diabetes in Nonalcoholic Fatty Liver Disease. Int J Mol Sci. 2020;21(11):3863. doi: https://doi.org/10.3390/ijms21113863
15. Wu H, Ballantyne CM. Metabolic Inflammation and Insulin Resistance in Obesity. Circ Res. 2020. doi: https://doi.org/10.1161/CIRCRESAHA.119.315896
16. Mercurio V, Carlomagno G, Fazio V, Fazio S. Insulin resistance: Is it time for primary prevention? World J Cardiol. 2012;4(1):1. doi: https://doi.org/10.4330/wjc.v4.i1.1
17. Vítek L. Bile Acids in the Treatment of Cardiometabolic Diseases. Ann Hepatol. 2017;16:S43-S52. doi: https://doi.org/10.5604/01.3001.0010.5496
18. Kiriyama Y, Nochi H. The Biosynthesis, Signaling, and Neurological Functions of Bile Acids. Biomolecules. 2019;9(6):232. doi: https://doi.org/10.3390/biom9060232
19. Nguyen A, Bouscarel B. Bile acids and signal transduction: Role in glucose homeostasis. Cell Signal. 2008;20(12):2180-2197. doi: https://doi.org/10.1016/j.cellsig.2008.06.014
20. Wu Y, Zhou A, Tang L, Lei Y, Tang B, Zhang L. Bile Acids: Key Regulators and Novel Treatment Targets for Type 2 Diabetes. J Diabetes Res. 2020;2020:1-11. doi: https://doi.org/10.1155/2020/6138438
21. Daniele G, Eldor R, Merovci A, et al. Chronic Reduction of Plasma Free Fatty Acid Improves Mitochondrial Function and Whole-Body Insulin Sensitivity in Obese and Type 2 Diabetic Individuals. Diabetes. 2014;63(8):2812-2820. doi: https://doi.org/10.2337/db13-1130
22. Shihabudeen MS, Roy D, James J, Thirumurugan K. Chenodeoxycholic acid, an endogenous FXR ligand alters adipokines and reverses insulin resistance. Mol Cell Endocrinol. 2015;414:19-28. doi: https://doi.org/10.1016/j.mce.2015.07.012
23. Hameed B, Terrault NA, Gill RM, et al. Clinical and metabolic effects associated with weight changes and obeticholic acid in non‐alcoholic steatohepatitis. Aliment Pharmacol Ther. 2018;47(5):645-656. doi: https://doi.org/10.1111/apt.14492
24. Nyangasa MA, Buck C, Kelm S, Sheikh MA, Brackmann KL, Hebestreit A. Association between cardiometabolic risk factors and body mass index, waist circumferences and body fat in a Zanzibari cross-sectional study. BMJ Open. 2019. doi: https://doi.org/10.1136/bmjopen-2018-025397
25. Lambert G, Amar MJA, Guo G, Brewer HB, Gonzalez FJ, Sinal CJ. The Farnesoid X-receptor Is an Essential Regulator of Cholesterol Homeostasis. J Biol Chem. 2003;278(4):2563-2570. doi: https://doi.org/10.1074/jbc.M209525200
26. Bilz S, Samuel V, Morino K, Savage D, Cheol SC, Shulman GI. Activation of the farnesoid X receptor improves lipid metabolism in combined hyperlipidemic hamsters. Am J Physiol - Endocrinol Metab. 2006. doi: https://doi.org/10.1152/ajpendo.00355.2005
27. Trauner M, Nevens F, Shiffman ML, et al. Long-term efficacy and safety of obeticholic acid for patients with primary biliary cholangitis: 3-year results of an international open-label extension study. Lancet Gastroenterol Hepatol. 2019. doi: https://doi.org/10.1016/S2468-1253(19)30094-9
Hanan Mohammed Amer, Professor
Internal Medicine, Endocrinology and Diabetes Department, Faculty of Medicine
El-Khalyfa El-Mamoun Street Abbasya, 11566, Cairo, Egypt
Mina Mikhail Nesim
Internal Medicine, Endocrinology and Diabetes Department, Faculty of Medicine
Сairo
Hany Khairy Mansour
Internal Medicine, Endocrinology and Diabetes Department, Faculty of Medicine
Сairo
Eman Nasr Omran
Internal Medicine, Endocrinology and Diabetes Department, Faculty of Medicine
Сairo
Nesma Hussien Ahmed
Internal Medicine, Endocrinology and Diabetes Department, Faculty of Medicine
Сairo
|
|
1. Figure 1. Mechanism of action of OCA. | |
| Subject | ||
| Type | Исследовательские инструменты | |
View
(142KB)
|
Indexing metadata ▾ | |
Amer H., Nesim M., Mansour H., Nasr E., Ahmed N. Obeticholic Acid and Insulin Sensitivity in Overweight Patients with Prediabetes. Obesity and metabolism. 2024;21(2):161-169. https://doi.org/10.14341/omet13088

 |
117292
Россия, Москва, ул. Дм. Ульянова, д.11
____________________________________
117292
11, Dm. Ul’yanova str., Moscow, Russian Federation


