


Contents
Scroll to:
 O. V. Povarova,
E. A. Gorodetskaya,
O. Y. Kulyak,
A. N. Demyanenko,
I. L. Alimova,
E. I. Kalenikova,
O. S. Medvedev
O. V. Povarova,
E. A. Gorodetskaya,
O. Y. Kulyak,
A. N. Demyanenko,
I. L. Alimova,
E. I. Kalenikova,
O. S. Medvedev https://doi.org/10.14341/omet12802
Scroll to:
BACKGROUND: According to the involvement of oxidative stress in the pathogenesis of obesity, the plasma level of coenzyme q10 in the correlation relationship with lipid metabolism disorders and functional liver state is of interest to study.
AIM: Substantiation of approaches to the correction of lipid metabolism disorders and non-alcoholic fatty liver disease in children with exogenous obesity based on the content of coenzyme Q10 and its relationship with lipid profile and liver enzymes.
MATERIALS AND METHODS: The single-center cross-sectional study enlisted the control (n=32, -1.0≤BMI SD score ≤+2.0) and obese (n=40, BMI SD score>+2.0) groups of children with the mean age of 12 yr. In all children BMI, lipidogram, liver enzymes (ALT and AST), plasma coenzyme Q10 and liver ultrasound examination were assessed.
RESULTS: Patients of both groups were comparable (p> 0.05) in age and gender. The level of coenzyme Q10 in the compared groups was comparable (p> 0.05) and did not differ in patients with different degrees of obesity. According to the results of the study of the lipid profile in the obese children, the level of HDL was lower, and the level of LDL was higher than that in control group. The highest value of HDL was obtained in the patients with the 1st degree of obesity and the highest level of triglycerides — in the patients with the 4th degree of obesity. The control group demonstrated moderate correlations between endogenous coenzyme Q10 and total cholesterol (r=0.474, p=0.009) which persists in patients with the first degree of obesity (r = 0.548, p = 0.035). There was no difference in AST in the study groups, however, the main group demonstrated elevated ALT and ALT/AST ratio (p <0.001). The highest ALT and ALT / AST ratio were observed in patients with greatest degree of obesity. Eighteen obese children (45%) had ALT / AST ratio ≥1 (in the control group –one patient (3%) (p <0.001), while fourteen patients showed liver enlargement and structure change according to ultrasound (80%). The control group demonstrated moderate correlations between endogenous coenzyme Q10 and total cholesterol (r=0.474, p=0.009) and between coenzyme Q10 and ALT / AST ratio (r=0.412, p=0.023) . In the obese group there was correlation between AI and ALT / AST (r = 0.436, p = 0.006) and in patients with the 1st degree of obesity — between also coenzyme Q10 and ALT (r = 0.875, p <0.001).
CONCLUSION: The disturbances in adequate control of cholesterol by coenzyme Q10 in obese children possibly confirming the involvement of oxidative stress in the pathogenesis of dyslipidemia and non-alcoholic fatty liver disease can serve as indication to use coenzyme Q10 in order to correct these complications.
Povarova O.V., Gorodetskaya E.A., Kulyak O.Y., Demyanenko A.N., Alimova I.L., Kalenikova E.I., Medvedev O.S. Substantiation of approaches to the correction of lipid metabolism disorders and non-alcoholic fatty liver disease in children with exogenous obesity. Obesity and metabolism. 2022;19(1):19-26. https://doi.org/10.14341/omet12802
In the 2000s, a number of age-related ‘old man’s somatic diseases’ were increasingly occurring in young adults. The reasons were the aggravating effects of such factors as physical inactivity, sedentary behavior, unhealthy diet, and repetitive stress leading todysfunctions of cardiovascular, endocrine, respiratory, and alimentary systems as well to psychological deviations. One of manifestations of this trend is the growing rate of obesity incidence in young adults [1]. According to WHO data, about 340 million children and adolescents aging 5 to 19 yr had obesity and overweight in 2016, while approximately one million children aging below 5 yr had the same problems in 2019 [2][3].
The obese children and adolescents should be carefully followed-up due to enhanced risk of metabolic syndrome and chronic diseases in adulthood [4].
The early diagnostics of such complications in obese children as dyslipidemia and NAFLD needs additional criteria to substantiate the timely measures to correct these pathologies [5][6]. Remembering implication of oxidative stress in obesity pathogenesis, it is instructive to examine the plasma level of coenzyme Q10 and its correlation with biochemical indices characterizing the disturbances in lipid metabolism and functional state of the liver [7].
The study focused on the plasma level coenzyme Q10 and its correlation with lipid profile and the levels of liver enzymes in children with exogenous constitutional obesity.
Research placement
The study enlisted the hospitalized patients examined in Pediatric Department N 1 of Smolensk Regional Children’s Hospital.
Research period
December 2018 – June 2019.
Control group: children with normal body weight.
Obese group: children with exogenous constitutional obesity.
In control group, the inclusion criteria were 1) age of 7-15 yr and 2) normal body weight.
In obese group, the inclusion criteria were 1) age of 7-15 yr and 2) exogenous constitutional obesity of 1-4 degree (BMI SD score>+2.0). In both groups, the exclusion criteria were: 1) established diagnosis of type 2 diabetes; 2) inflammatory and/or autoimmune liver diseases; and 3) intake of medications.
Unselected sampling.
The comparative single-center cross-sectional interventional two-sample study.
The following data were harvested from all the patients:
The height was determined with a standard stadiometer to within 0.5 cm, while the body weight was measured with bathroom scales to within 0.1 kg.
To determine the liver enzymes and biochemical indices of lipid metabolism, the blood was drawn in the morning under fasting conditions
To assay for СоQ10, the blood (1.5 ml) was similarly drawn into tubes supplemented with heparin. The blood plasma was separated by centrifugation and stored at -20°C prior to examination.
The routine clinical data included the anthropometric parameter BMI SD score (the number of standard deviations around the mean BMI for a given age and sex). The diagnostic criterion of obesity was BMI SD>+2.0 [8].
The plasma level of СоQ10 was determined with validated assay based on HPLC and electrochemical detection employing the equipment of Environmental Sciences Associate (USA). Sampling and processing of the chromatographic data were performed with the software of the same firm. The lower limit of СoQ10 assay was 0.25 µg/ml [9]. The reference values of СoQ10 level were 0.4–1.0 nM/l.
The blood biochemical profile, which was obtained on automated IndikohermoScientific system, included the total cholesterol, TG, LDL, HDL, ALT, and AST. The atherogenic index (AI) was calculated as (total cholesterol [mM] – HDL [mM])/HDL [mM].
Dyslipidemia was established if two or more parameters were higher or lower than the normal values [8].
US of the liver was carried out on a Philips EPIQ 7 system. NAFLD was diagnosed in patients with hepatomegaly, heterogeneous hepatic parenchyma, and depletion of vascular pattern revealed by Doppler color mapping [8].
To assess the effect of obesity degree on СoQ10 level, lipid profile, and the liver enzymes, the patients in obese group were subdivided into 4 subgroups according to degrees 1-4 of obesity.
To examine the correlation between СoQ10 level and the lipid profile, the obese patients were further subdivided into 2 groups with and without dyslipidemia.
To assess correlation between СoQ10 level and the liver enzymes, the obese patients were also subdivided into 2 groups with ALT/AST≥1 and ALT/AST<1.
The results were statistically processed using Statistica 7.0 (StatSoft) software. Since most indices were distributed abnormally, the data were analyzed with non-parametrical tests. The quantitative data are presented as Me [Q1-Q3], while the qualitative ones are given as the absolute values (n) and/or incidence (%). Multiple comparison analysis of the quantitative data for 3 or more samples was performed with Kruskal—Wallis H-test and Bonferroni correction. The paired data were compared with Mann-Whitney U-test. Thequalitative parameters were compared with Fisher’s exact test at p<0.05. Correlation between two parameters was assessed with Spearman’s rank-order correlation coefficient.
The study was approved by the Ethical Committee of Smolensk State Medical University (Protocol No. 17, November 25, 2017). All patients gave a written informed consent for a research study and for personal data processing.
A total of 72 patients were examined and divided into obese group with exogenous constitutional obesity (n=40) and the control one with normal body weight (n=32). In both groups, the patients were matched by age [correspondingly, 12.0 yr (8.0–15.0) and 12.0 yr (7.0–15.0)] and sex (respectively, m/w 25/15 and 20/12).
The biochemical data are summarized in Table 1. In each group, the obtained parameters did not differ between boys and girls, which made it possible to compare the groups without gender corrections.
Table 1. Blood biochemical parameters (Me [Q1-Q3])
|
Parameter |
Obese group (n=40) |
Control group (n=32) |
p |
|
СoQ10 (µg/ml) |
0.8 (0.2–1.8) |
0.7 (0.2–1.5) |
>0.05 |
|
Total cholesterol (mM) |
4.35 (2.90–7.60) |
4.30 (3.50–5.60) |
>0.05 |
|
HDL (mM) |
1.3 (0.7–2.9) |
1.7 (0.9–2.5) |
0.008 |
|
LDL (mM) |
2.9 (1.5–6.1) |
2.6 (1.8–3.9) |
0.048 |
|
TG (mM) |
1.06 (0.43–3.91) |
0.97 (0.46–1.78) |
>0.05 |
|
AI |
2.5 (0.6–8.2) |
1.7 (0.7–3.8) |
<0.001 |
|
ALT (U/l) |
26.0 (11.0–82.0) |
16.0 (7.0–25.0) |
<0.001 |
|
AST (U/l) |
25.0 (15.0–49.0) |
26.0 (14.0–52.0) |
>0.05 |
|
ALT/AST ratio |
1.0 (0.5–1.6) |
0.6 (0.3–1.1) |
<0,001 |
Note. СoQ10, coenzyme Q10; HDL, high-density lipoproteins; LDL, low-density lipoproteins; TG, triglycerides; AI, atherogenic index; ALT, alanine aminotransferase; AST, aspartate aminotransferase.
In control and obese groups, the СoQ10 levels were similar (p>0.05); they also did not significantly differ in the subgroups of obese patients with various degrees of obesity (Table 2). Increased СoQ10 levels were observed in 6 (15%) patients of obese group and in 4 (12.5%) control one. Decreased СoQ10 was revealed in 5 (12.5%) obese patients and in 5 (15.6%) controls.
Table 2. Biochemical blood parameters in obese group with different degrees of obesity (Me [Q1-Q3])
|
Parameter |
Degree I (n=8) |
Degree II (n=16) |
Degree III (n=12) |
Degree IV (n=4) |
p |
|
СoQ10 (µg/ml) |
0.48 (0.42–0.82) |
0.6 (0.71–0.87) |
0.66 (0.46–0.77) |
0.89 (0.55–1.23) |
>0.05 |
|
Total cholesterol (mM) |
4.80 (4.00–5.45) |
4.20 (4.10–4.76) |
4.65 (3.80–4.98) |
4.05 (4.02–5.20) |
>0.05 |
|
HDL (mM) |
1.78 (1.54–1.84) |
1.16 (0.96–1.37) |
1.29 (1.06–1.59) |
0.88 (0.83–1.11) |
0.001 |
|
LDL (mM) |
2.84 (2.06–3.46) |
2.95 (2.65–3.31) |
2.94 (2.28–3.32) |
2.64 (2.50–3.70) |
>0.05 |
|
TG (mM) |
1.01 (0.67–1.29) |
1.00 (0.71–1.22) |
1.05 (0.89–1.16) |
1.70 (1.46–2.34) |
0.023 |
|
AI |
1.92 (1.27–2.71) |
2.68 (2.05–3.67) |
2.43 (1.85–2.67) |
3.44 (2.68–4.84) |
0.087 |
|
ALT (U/l) |
26.0 (15.0–27.3) |
30.0 (17.5–37.5) |
23.5 (14.8–27.8) |
37.0 (31.8–44.0) |
0.001 |
|
AST (U/l) |
26.5 (21.3–33.0) |
25.0 (18.5–46.5) |
24.0 (21.8–27.0) |
29.0 (23.0–30.5) |
>0.05 |
|
ALT/AST ratio |
0.84 (0.80–0.93) |
0.97 (0.8–1.35) |
0.94 (0.7–1.10) |
1.52 (1.42–1.56) |
0.016 |
Note. СoQ10, coenzyme Q10; HDL, high-density lipoproteins; LDL, low-density lipoproteins; TG, triglycerides; AI, atherogenic index; ALT, alanine aminotransferase; AST, aspartate aminotransferase.
In obese patients, HDL were lower and LDL were higher in comparison with the control values (Table 1), which explains the higher AI in the obese group. In obese patients with various degrees of obesity, the HDL levels were different, the highest values were observedin patients with obesity degree I. Similar variety was also observed in TG levels, which were the greatest in patients with obesity degree IV (Table 2).
In control and obese groups, the levels of total cholesterol did not differ significantly. However, an enhanced cholesterol was more frequently documented in obese children than in the control ones (correspondingly, in 8 (20 %) and 1 (3%) patients, р=0.037). Moreover, 15 (37.5%) obese patients had dyslipidemia vs one patient in the control group (3%, р<0.001). However, СoQ10 level in these patients [0.81 (0.52–0.86)] did not significantly differ from that observed in patients without dyslipidemia [0.72 (0.46–0.91)].
In the control group, there was correlation between СoQ10 and total cholesterol (r=0.474, р=0.009), but in the obese group similar correlation was established only in the subgroup of patients with obesity degree I (r=0.548, р=0.035, Fig. 1).
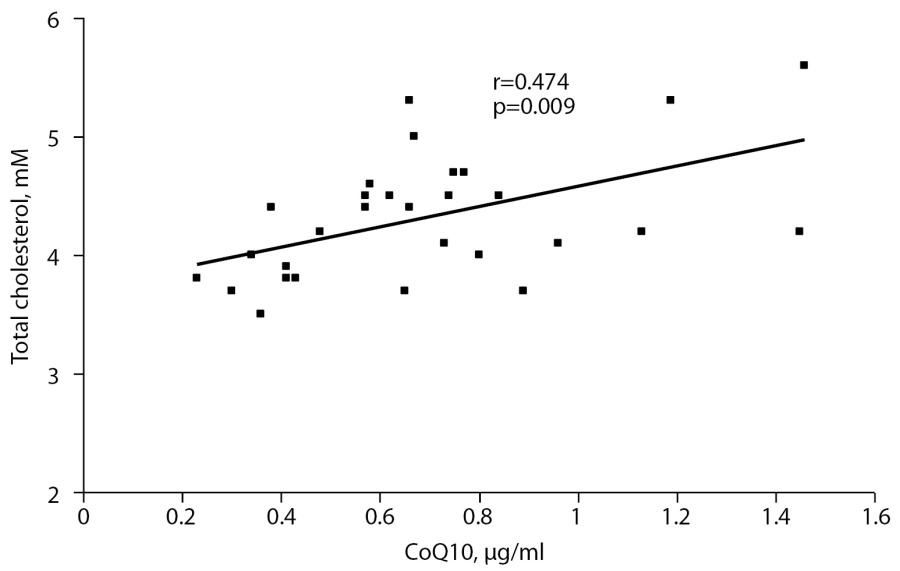
Fig. 1. Correlation between СоQ10 and total cholesterol in the control group.
There were no significant difference in AST between both groups, although ALT level and ALT/AST ratio were significantly higher in obese patients (p<0.001, Table 1). At this, the greatest values of ALT and ALT/AST were observed in patients with obesity degree IV (Table 2).
In 18 obese patients (45%) ALT/AST was ≥1. In control group, such ratio was observed only in one patient (3%, p<0.001). At this, in 14% obese patients (80%) US revealed increased hepatic lobes and the altered structure of the liver.
In control group, there was a positive correlation between plasma СoQ10 and ALT/AST ratio (r=0.412, р=0.023, Fig. 2). In obese group, similar correlation was established between AI and ALT/AST (r=0.436, р=0.006, Fig. 3). The patients with obesity degree I demonstrated a strong correlation between СoQ10 and ALT (r=0.875, р<0.001).
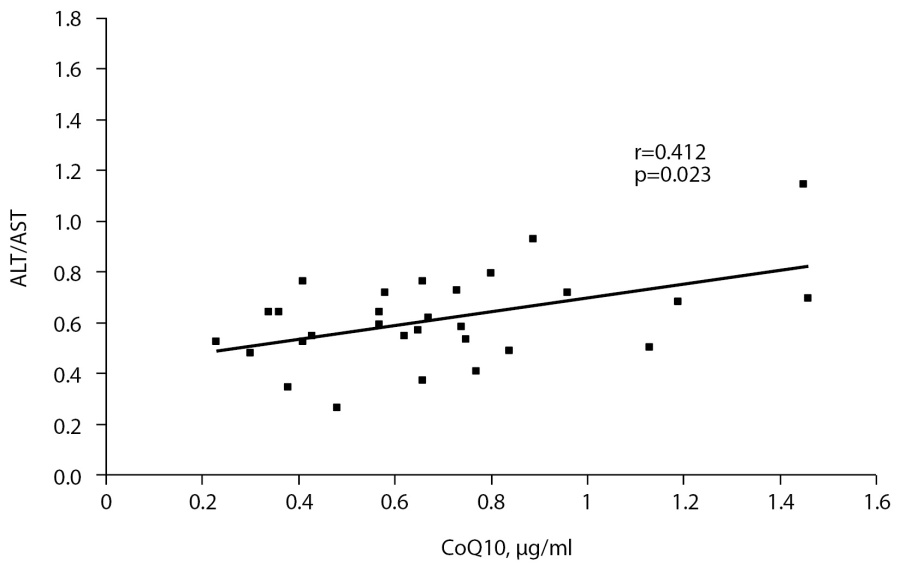
Fig. 2. Correlation between СоQ10 and ALT/AST ratio in the control group.
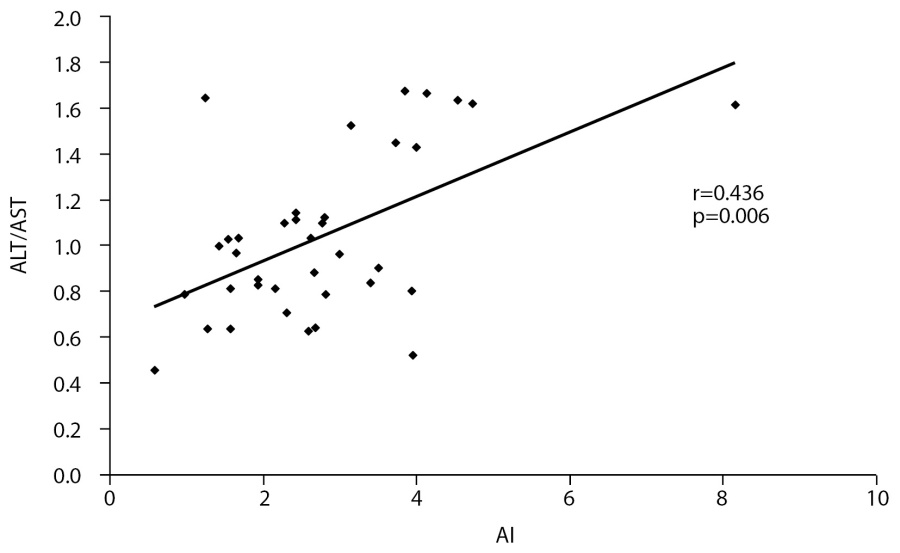
Fig. 3. Correlation between AI and ALT/AST ratio in obese group.
The patients were sampled in Smolensk Regional Children’s Clinical Hospital (Smolensk, Russia) according to the case-control criterion. Prior to the study, sample size was not assessed.
One of pathological elements of obesity manifested by chronic inflammation is oxidative stress [7]. Numerous clinical studies of obese patients revealed down-regulated activities of antioxidant enzymes (SOD and glutathione peroxidase) in parallel with a decrease oftotal antioxidant status of blood plasma as well as with positive correlations between the levels of these oxidative stress markers and BMI [10-12]. Remembering the most important role of СoQ10 in the work of mitochondrial respiratory chain and its implication in theantioxidant function, attention of the researches to this agent becomes apparent [13][14].
Our study, which predominantly focused on the children with obesity degrees II and III, did not reveal significant deviation of plasma СoQ10 level from the control one. The literature reports the controversial data on relationship between obesity and plasma СoQ10. Actually, A. Gvozdjakova and coauthors observed a drop in total plasma СoQ10 correspondingly in 51 and 59% boys and girls aging 10-18 yr and characterized with predominantly moderate obesity as well as with enhanced total cholesterol [14]. Examination of obese children of the same ages revealed elevated total cholesterol and LDL but decreased plasma СoQ10 level [15]. However, the study of T. Menke and coworkers did not reveal the changes in СoQ10/cholesterol ratio in children aging 10-13 yr, which were characterized with moderate obesity and enhanced plasma cholesterol [16].
It is a common knowledge that blood plasma cholesterol is the major carrier of СoQ10, while СoQ10 is the most important component of its antioxidant protection [13]. Here, in the obese examinees, the positive correlation between СoQ10 and total cholesterol was observed only in patients with obesity degree I, which was also revealed in the control group. In contrast, such correlation was not observed in obese patients with obesity degrees II-IV. In these patients, the established disturbance in adequate supplement of cholesterol with СoQ10 can result from a down-regulated level of this enzyme in the liver against the background inflammation; it also can be a factor leading to dyslipidemia observed in these children. According to the data of A. Gvozdjakova and coworkers, progress of obesity inchildren is accompanied with further elevation of cholesterol and diminished plasma СoQ10 [14].
According to modern pathogenetic views, obesity is consequential to inflammation in fat tissue tending to spread also into hepatocytes followed by the development of complications manifested by NAFLD. At this, ALT/AST ≥1 is viewed as one of NAFLD criteria [17-19].
Here, the obese children demonstrated a significant 2-fold elevation of ALT (within the limits of reference levels) and ALT/AST ratio. In this group, elevation of ALT/AST ratio correlated with the symptoms of dyslipidemia reflecting the relationship between inflammatory alterations in hepatocytes and enhanced intensity of oxidative processes. Based on subcellular histological alterations in the liver manifested by accumulation of fatty acids in hepatocytes as well as by oxidation of phospholipids in plasmalemma and mitochondrial membranes, some researchers consider NAFLD as a ‘mitochondrial disease’ [20]. The review of K. Botham and coauthors analyzes numerous clinical and experimental studies of NAFLD and reports the controversial data on the changes of СoQ10 level, which either enhanced or decreased in blood plasma and hepatic tissue, probably reflecting various stages of some pathological process in the liver and a gradual drop of stored СoQ10 [21]. Our study revealed correlation between ALT/AST ratio and plasma СoQ10 in the control children as well as the absence of such correlation in obese patients, although children with obesity degree I demonstrated a positive correlation between СoQ10 and ALT. In obese patients, the disbalance between ALT/AST ratio and СoQ10 level can result from diverse changes in plasma ALT and СoQ10 due to a pathological process in the liver, which elevates the content of liver enzymes in blood plasma and depletes the stored СoQ10 due to down-regulated synthesis of this endogenous antioxidant.
The limitations result from a small sample of the obese patients, especially those with obesity degrees I and IV.
Future studies will continue examination of the effectiveness of therapeutic application of СoQ10 to correct dyslipidemia in obese children.
Examination of children with exogenous constitutional obesity revealed disturbances of lipid metabolism and the changes in activity of the liver enzymes, which augmented progressively with obesity degree.
The control children without obesity demonstrated positive correlations between СoQ10 level on the one hand, and total cholesterol as well as ALT/AST ratio, on the other hand. Such correlations were also observed in children with obesity degree I, but they disappeared as the disease progressed.
Thus, inadequate supplement of cholesterol with СoQ10 observed in children with exogenous constitutional obesity reflects the pathogenetic role of oxidative stress in the development of dyslipidemias as well as NAFLD and can be an indication to prescribe theСoQ10 preparations to treat these diseases.
Research funding. This study was initiative and not supported by any financing.
Competing interests: The authors declare that they have no competing interests related to the content of this paper.
Author contributions. Povarova O.V. developed the protocol of the study, collected, processed, interpreted the results, and prepared the manuscript; Gorodetskaya E.A. developed the protocol of the study, interpreted the data, controlled and coordinated the research, and edited the manuscript; Kulyak O.Y. preformed the chromatographic analysis of the СoQ10 level, collected, processed, and interpreted the data; Demyanenko A.N. collected, processed, and interpreted the data as well as edited the manuscript; Alimova I. L. developed the protocol of the study, collected and analyzed the data, and prepared the manuscript; Kalenikova E.I. preformed the chromatographic analysis of the СoQ10 level, analyzed and interpreted the data, and prepared the manuscript; and Medvedev O.S. analyzed and interpreted the data as well as edited the manuscript. All authors approved the final version of the manuscript prior to publication. They agree to be responsible for all aspects of this study implying proper examination and solution of the problems related to the accuracy and scrupulosity in performing any part of the work.
1. Wang LX, Gurka MJ, DeBoer MD. Metabolic syndrome severity and lifestyle factors among adolescents. Minerva Pediatr. 2018;70:467-475. doi: https://doi.org/10.23736/S0026-4946.18.05290-8
2. Garwood P, Chaib F, Brogan C. Tenfold increase in childhood and adolescent obesity in four decades: new study by Imperial College London and WHO.[cited 2017 October 11]. Available from: https:// www.who.int/news/item/11-10-2017-tenfold-increase-in-childhoodand-adolescent-obesity-in-four-decades-new-study-by-imperialcollege-london-and-who
3. WHO: obesity and overweight. [cited 2020 April 4]. Available from: https://www.who.int/news-room/fact-sheets/detail/obesity-andoverweight
4. Bokova TA. Non-alcoholic fatty liver disease in children: relationship with the main components of metabolic syndrome in children. Experimental and Clinical Gastroenterology. 2020;173 (1):15-20. (In Russ.) doi: https://doi.org/10.31146/1682-8658-ecg-173-1-15-20
5. Weihe P, Weihrauch-Blüher S. Metabolic syndrome in children and adolescents: diagnostic criteria, therapeutic options and perspectives. Curr Obes Rep. 2019;8:472-479. doi: https://doi.org/10.1007/s13679-019-00357-x.
6. DeBoer MD. Assessing and managing the metabolic syndrome in children and adolescents. Nutrients. 2019;11:1788-1790. doi: https://doi.org/10.3390/nu11081788
7. Manna P, Jain SK. Obesity, oxidative stress, adipose tissue dysfunction, and the associated health risks: causes and therapeutic strategies. Metab Syndr Relat Disord. 2015;10:423-444. doi: https://doi.org/10.1089/met.2015.0095
8. Klinicheskiere komendacii «Ozhirenie u detej» 2021. (In Russ.). Доступно по: http://cr.minzdrav.gov.ru/recomend/229_2. Link active on 12.10.2021.
9. Kalenikova EI, Gorodetskaya EA, Medvedev OS. Pharmacokinetics of coenzyme Q10. Bull Exp Biol Med. 2008;146 (3):313-316. doi: https://doi.org/10.1007/s10517-008-0270-8
10. Kodentsova VM, Vrzhesinskaya OA, Kosheleva OV, et al. Antioxidant vitamin status of obese patients in terms of the risk of comorbidities. Obesity and metabolism. 2020;17 (1):22-32. (In Russ.). doi: https://doi.org/10.14341/omet10144
11. Povarova OV, Gorodetskaya EA, Kalenikova EI, Medvedev OS. Metabolic markers and oxidative stress in children’s obesity pathogenesis. Russian Bull Perinatol Pediatr. 2020;65 (1):22-29. (In Russ.). doi: https://doi.org/10.21508/1027-4065-2020-65-1-22-29
12. Vona R, Gambardella L, Cittadini C, et al. Biomarkers of Oxidative Stress in Metabolic Syndrome and Associated Diseases. Oxid Med Cell Longev. 2019;2019:1-19. doi: https://doi.org/10.1155/2019/8267234
13. Casagrande D, Waib PH, Jordão Júnior AA. Mechanisms of action and effects of the administration of Coenzyme Q10 on metabolic syndrome. J Nutr Intermed Metab. 2018;13:26-32. doi: https://doi.org/10.1016/j.jnim.2018.08.002
14. Gvozdjakova A, Kucharska J, Tkacov M, et al. Ratio of lipid parameters to coenzyme Q10 could be used as biomarker of the development of early complications of obesity in children. Bratisl. Lek. Listy. 2012;113:21-25. doi: https://doi.org/10.4149/BLL_2012_005
15. Muhtagorlu S, Koca SO, Cetin I, et al. Investigation of ischemia modified albumin and coenzyme Q10 levels in obese children with metabolic syndrome. TJB. 2016;41:443-449. doi: https://doi.org/10.1515/tjb-2016-0147
16. Menke T, Niklowitz P, de Sousa G, et al. Comparison of coenzyme Q10 plasma levels in obese and normal weight children. Clin. Chim. Acta. 2004;349:121-127. doi: https://doi.org/10.1016/j.cccn.2004.06.015
17. Pavlovskaya EV, Strokova TV, Pyriva EA, Shilina NM. Non-alcoholic fatty liver disease in obese children: modern aspects of diagnosis and treatment. Pediatric Nutrition. 2021;19 (2):53-61. (In Russ.). doi: https://doi.org/10.20953/1727-5784-2021-2-53-61
18. Kawamoto R, Kohara K, Kusunoki T, et al. Alanine aminotransferase/ aspartate aminotransferase ratio is the best surrogate marker for insulin resistance in non-obese Japanese adults. Cardiovasc Diabetol. 2012;11:1-8. doi: https://doi.org/10.1186/1475-2840-11-117
19. Homsanit M, Sanguankeo A, Upala S, Udol K. Abnormal liver enzymes in Thai patients with metabolic syndromes. J Med Assoc Thai. 2012;95:444.
20. Ajith TA. Role of mitochondria and mitochondria-targeted agents in non-alcoholic fatty liver disease. Clin Exp Pharmacol Physiol. 2018;45:413-421. doi: https://doi.org/10.1111/1440-1681.12886
21. Botham KM, Napolitano M, Bravo E. The emerging role of disturbed CoQ metabolism in nonalcoholic fatty liver disease development and progression. Nutrients. 2015;7:9834-9846. doi: https://doi.org/10.3390/nu7125501
Oxana V. Povarova, MD, PhD]; адрес: 119991, Россия, г. Москва, Ломоносовский проспект, д. 27, корп. 1 [address: 27/1, Lomonosov avenue, 119991, Moscow
Researcher ID: R-3090-2016;
Scopus Author ID: 6603347164;
eLibrary SPIN: 6244-2772
Evgeniya A. Gorodetskaya, Ph in biology
Moscow
Scopus Author ID: 6603700637;
eLibrary ID: 82831
Olesya J. Kulyak, Ph in pharmacy
Moscow
Researcher ID: AAO-6219-2021;
Scopus Author ID: 57039988900;
eLibrary SPIN: 9697-1220
Alexandra N. Demyanenko, MD, PhD
Smolensk
eLibrary SPIN: 6889-8349
Irina L. Alimova, MD, PhD, Professor
Smolensk
eLibrary SPIN: 4583-9822
Elena I. Kalenikova, Ph in pharmacy, Professor
Moscow
Scopus Author ID: 6603796631;
eLibrary SPIN: 5868-6998
Oleg S. Medvedev, MD, PhD, Professor
Moscow
Researcher ID: A-5674-2016;
Scopus Author ID: 7103337682;
eLibrary SPIN: 7696-3683
|
|
1. Рисунок 1. Корреляционные взаимосвязи между коэнзимом Q10 и общим холестерином в контрольной группе. | |
| Subject | ||
| Type | Исследовательские инструменты | |
View
(73KB)
|
Indexing metadata ▾ | |
|
|
2. Рисунок 2. Корреляционные взаимосвязи между коэнзимом Q10 и отношением АЛТ/АСТ в контрольной группе. | |
| Subject | ||
| Type | Исследовательские инструменты | |
View
(73KB)
|
Indexing metadata ▾ | |
|
|
3. Рисунок 3. Корреляционные взаимосвязи между индексом атерогенности и отношением АЛТ/АСТ в основной группе. | |
| Subject | ||
| Type | Исследовательские инструменты | |
View
(67KB)
|
Indexing metadata ▾ | |
Povarova O.V., Gorodetskaya E.A., Kulyak O.Y., Demyanenko A.N., Alimova I.L., Kalenikova E.I., Medvedev O.S. Substantiation of approaches to the correction of lipid metabolism disorders and non-alcoholic fatty liver disease in children with exogenous obesity. Obesity and metabolism. 2022;19(1):19-26. https://doi.org/10.14341/omet12802

 |
117292
Россия, Москва, ул. Дм. Ульянова, д.11
____________________________________
117292
11, Dm. Ul’yanova str., Moscow, Russian Federation


